Method
How Orakta works
Orakta measures radar change at a confirmed point, compares it with the normal change at the same place a year earlier, and wraps the result in imagery, limits and provenance.
From address to report
-
Send the addresses
Up to 3 addresses and the event date, by form or email. We confirm the exact building with you on a map before anything runs.
-
Free imagery check
The same business day, we tell you whether sharp satellite imagery exists before and after the date. Radar from the twelve months before is compared with the weeks after, so the date must be at least 12 days in the past.
-
Get the record
A PDF report with a plain-language result, imagery and limits, plus a JSON evidence bundle with scene IDs, capture dates, licences and SHA-256 hashes of every figure.
The measurement
Radar change against a local baseline
Sentinel-1 is a radar satellite: it sends its own signal, so it sees through cloud and at night. For each 10 m pixel around the pin, Orakta compares the radar signal in the twelve months before the event with the weeks after it, using a published method called the Pixel-Wise T-Test. Large, consistent shifts are typical of collapsed or heavily damaged structures.
A fixed threshold is not enough: cities change all the time. So Orakta runs the same test on the same months one year earlier. That local control sets the threshold for this exact place, and the report states whether the change after the event is above or below it.
Only built-up pixels are analysed, using the ESA WorldCover map. On top of the published method we apply our own calibration, tested on damaged and undamaged control cities.
The 10 m measurement is not shown as a picture. What you see is sharp satellite radar of the buildings themselves: Umbra at 0.41 m and 0.43 m, before and after lava reached Grindavík, Iceland, on 14 January 2024.
Satellite radar example · Grindavík, Iceland, 2024 · not an Israeli case
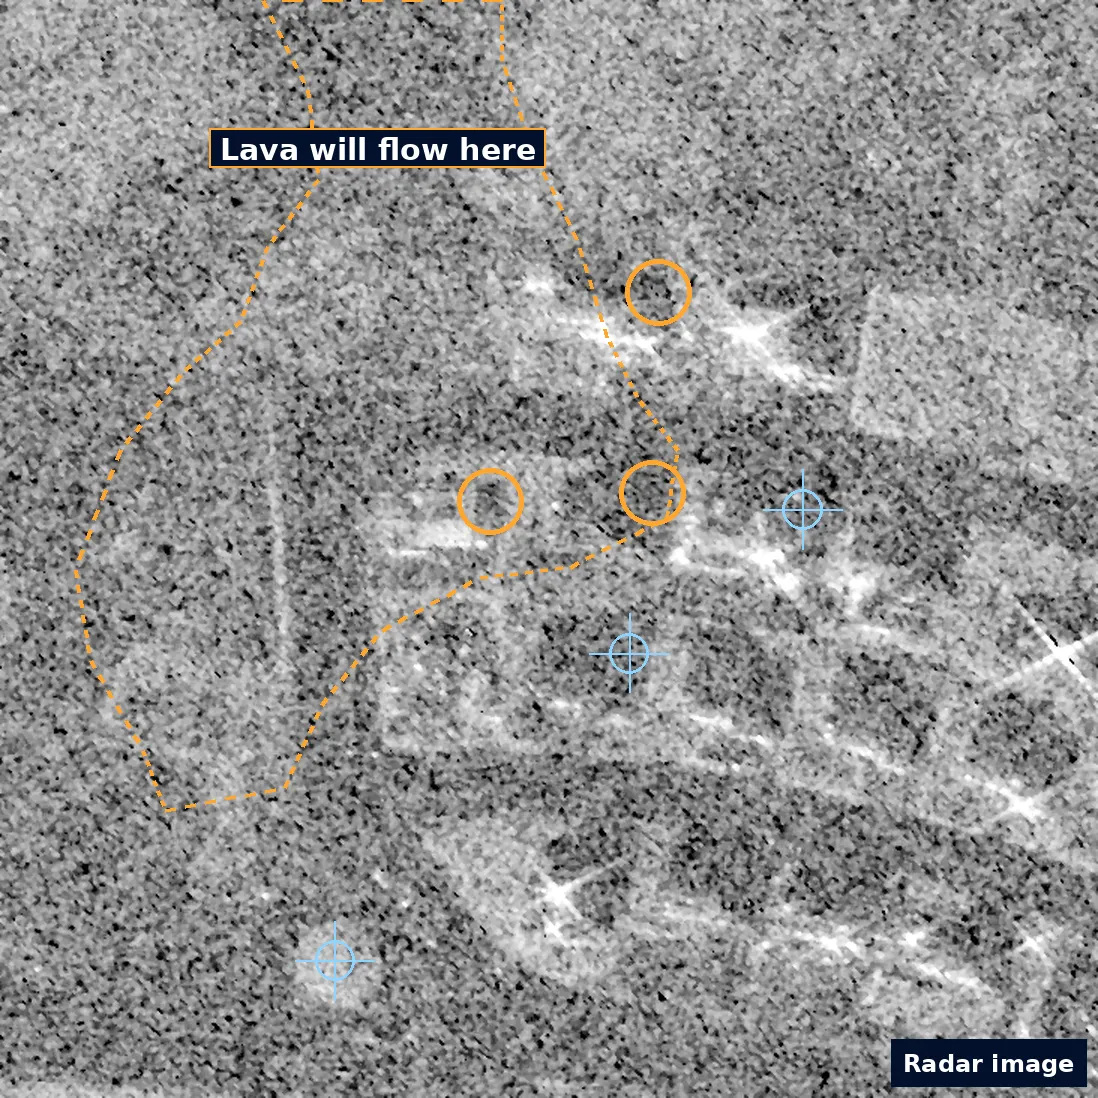
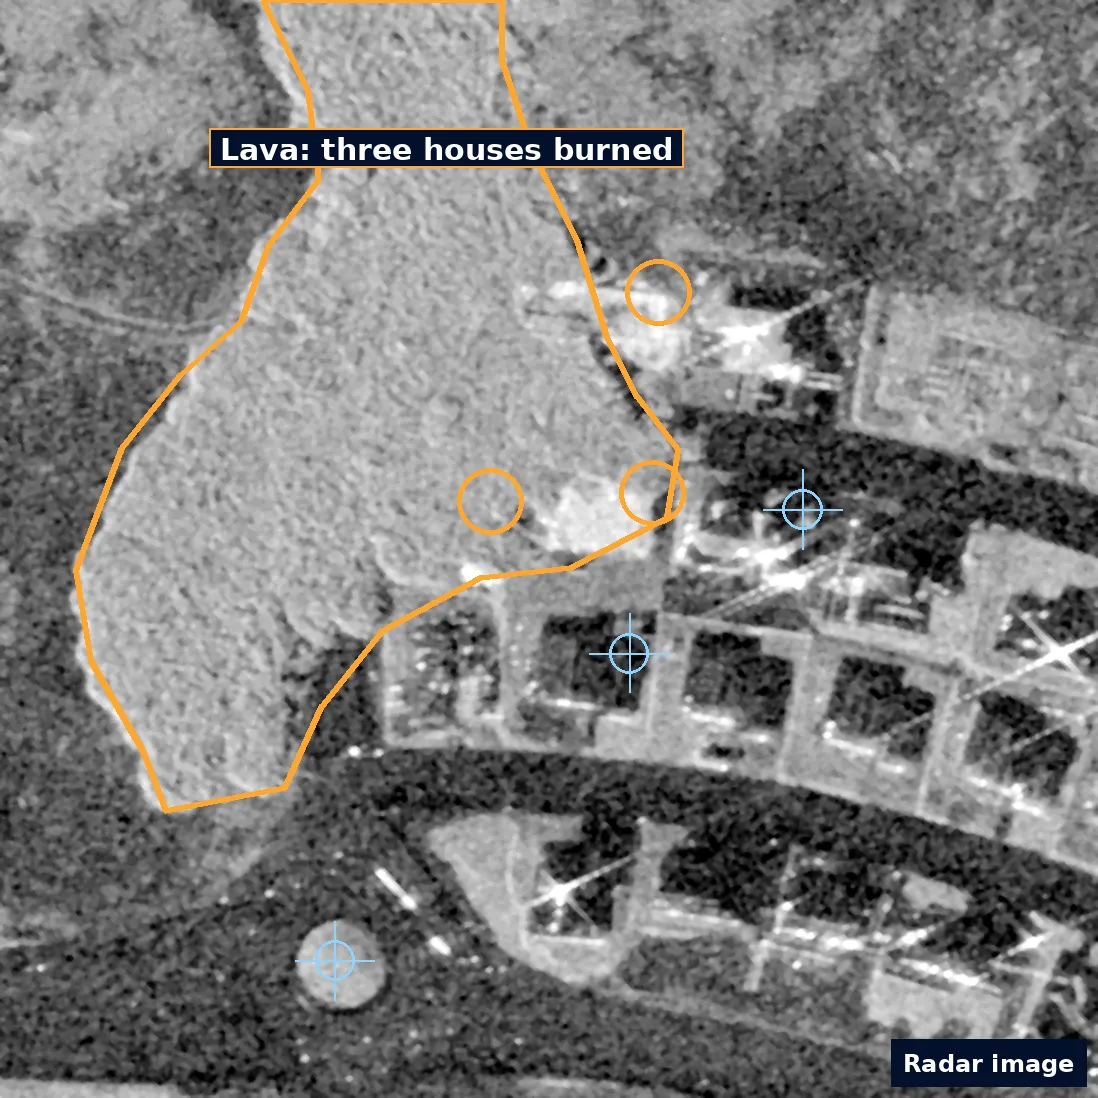
Satellite radar images, not photos. Amber: the lava edge (dashed before, solid after) and the three houses it burned on 14 January 2024. Blue crosses mark the same unchanged points in both images. The before image is grainier.
Data sources
Open data first, licences on every image
Orakta searches open archives before anything paid. Each image in a report carries its source and licence. Non-commercial imagery is never placed in a paid report.
| Source | Role in the report | Resolution | Licence |
|---|---|---|---|
| Sentinel-1 (Copernicus) | Radar change measurement. Works through cloud and at night. | ~10 m | Free and open Copernicus data, attribution required |
| Sentinel-2 (Copernicus) | Optical context at the scale of the measurement. | 10 m | Free and open Copernicus data, attribution required |
| ESA WorldCover | Built-up mask: only built-up pixels are analysed. | 10 m | CC BY 4.0 |
| Maxar / Vantor Open Data | Sharp before-and-after imagery where the archive covers the place. | Sub-metre | CC BY-NC 4.0: never used in a paid report |
| Capella and Umbra open data | Sharp radar imagery where the archive covers the place. | Sub-metre to metre | Provider open-data licences, attribution required |
| Commercial imagery | 30 cm satellite imagery for paid reports, ordered only after you approve the exact total. | 30 cm | Commercial licence per report |
-
Sentinel-1 (Copernicus)
Radar change measurement. Works through cloud and at night.
- Resolution
- ~10 m
- Licence
- Free and open Copernicus data, attribution required
-
Sentinel-2 (Copernicus)
Optical context at the scale of the measurement.
- Resolution
- 10 m
- Licence
- Free and open Copernicus data, attribution required
-
ESA WorldCover
Built-up mask: only built-up pixels are analysed.
- Resolution
- 10 m
- Licence
- CC BY 4.0
-
Maxar / Vantor Open Data
Sharp before-and-after imagery where the archive covers the place.
- Resolution
- Sub-metre
- Licence
- CC BY-NC 4.0: never used in a paid report
-
Capella and Umbra open data
Sharp radar imagery where the archive covers the place.
- Resolution
- Sub-metre to metre
- Licence
- Provider open-data licences, attribution required
-
Commercial imagery
30 cm satellite imagery for paid reports, ordered only after you approve the exact total.
- Resolution
- 30 cm
- Licence
- Commercial licence per report
Location search uses OpenStreetMap-based services (Photon for suggestions, Nominatim for the final lookup). You confirm the pin on a map before a report is prepared.
Limits
What a report cannot tell you
- A radar pixel is about 10 × 10 m and can cover several buildings. The result is not a building-by-building damage assessment.
- Construction, demolition, debris clearing, vegetation and flooding also change radar and can look like damage.
- Light damage to windows, roofs or interiors is usually invisible from orbit.
- Sharp archive imagery exists only for some places and dates. When it is missing, the report says so.
- Viewing angles and seasons differ between images, so buildings can appear shifted.
Requires expert review A screening indicator, not proof of damage, not a valuation and not a legal or engineering opinion.
Run the method on your own addresses.
Send up to 3 addresses and the event date for a free imagery check. The sample report shows every step of this page on the February 2023 earthquake in Türkiye, used only as an accuracy-validation dataset.